Monitoring Resources on Dokku
Hey 👋, if you want to monitor the resources in your Dokku server you are in the right place.
The last few days I had some CPU peaks that triggered some alerts in my DigitalOcean server. I didn’t know the source of this and I was surprised that I was basically blind to the resources that each of my Dokku apps were consuming.
I reached out to the Dokku Discord and it was clear that the kind of monitoring I was looking for is not something that Dokku wants to focus. They even have a blog post about that.
They suggested me to try DataDog (that seems to provide a good enough free tier) and that’s what I did.
These are the steps I followed to have it running:
- Created an account in DataDog.
- And followed the on-screen instructions to install the DataDog agent in my Ubuntu server.
- After that, I followed some extra instructions to setup the Docker integration. Which implied creating some config file.
- Restarted the agent (
sudo systemctl restart datadog-agent). - Done.
This is the kind of information you will get in the default Docker dashboard:
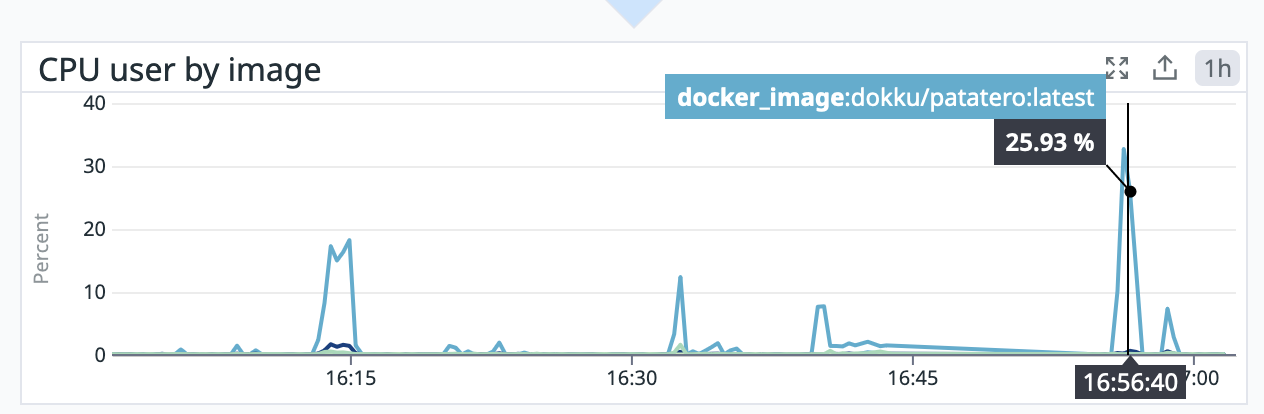
As you can see this is very useful and easy to setup.
It was nice to see which images were consuming more resources (CPU, bandwidth and memory). And allowed me to identify what was the problem in my case (an outdated app that was consuming a lot of CPU).
All of this to say that, you might just need to monitor your Docker resources – since as you might have noticed none of these steps are directly related to Dokku.
Some alternatives to DataDog can be found in the blog post from Dokku I mentioned before. Or you can even go and try to setup something yourself.
Monitoring is a big world in itself. My only suggestion is to not host it yourself (if you are a bit limited on resources). Since it might be better to have your monitoring solution in a different system than the one you are monitoring.
Let me know if this post was any helpful to you by clicking the 👍 button below! Helps me a lot!
Or drop me an email if you got stuck somewhere and I will try to help you better :)
Send a comment